Chapter 2
Getting started
This chapter tells how to start and exit Performance Manager, and explains the GUI's main window.
Starting Performance Manager
Log in to a node where Performance Manager has been installed. If the rehash command has not been issued since Performance Manager was installed, type this command to recreate the internal command tables used by the shell:
rehash
Before starting Performance Manager, be sure the
DISPLAY
environment variable on the starting system is set for the display you wish to use.
There are additional considerations if you wish to display Performance Manager on a PC. To start Performance Manager, issue the
/usr/bin/x11/pmgr
command at a root prompt (see the
pmgr(8)
reference page for details):
/usr/bin/x11/pmgr
Performance Manager can be started from a non-root account, but the log file (
/var/opt/pm/l/pmgr_gui.log
) must first have its permissions changed to allow non-root users to write to it; for example, issue the following command as root to make the log file writable by everyone:
chmod 666 /var/opt/pm/l/pmgr_gui.log
When Performance Manager starts, it opens its main window on the workstation defined by the
DISPLAY
environment variable.
Exiting Performance Manager
To exit Performance Manager, from the File menu, choose
Exit
. Your current session will not be saved when exiting. To save a session, choose
Save Session
or
Save Session As
from the main window's File menu.
Save Session As
opens a file selection dialog box.
More introductory information
These topics will help introduce you to Performance Manager's operations.
Setting the
DISPLAY
environment variable
To set the
DISPLAY
environment variable in a C shell (
csh
), issue the following command, where
workstation
is the node name of your workstation:
setenv DISPLAY
workstation
:0.0
To set the DISPLAY environment variable in a Bourne shell (sh), issue the following commands, where workstation is the node name of your workstation:
DISPLAY=
workstation
:0.0
export DISPLAY
Your workstation should be a Tru64 UNIX node running the Common Desktop Environment (CDE). Nodes running other operating systems and other window managers might work, but only Tru64 UNIX and CDE have had full quality assurance testing for Performance Manager.
If you are running Performance Manager remotely, be sure your workstation supports the GUI display.
Displaying Performance Manager on a PC
Performance Manager can be displayed on most PCs. Either start Performance Manager through a PC X server program (such as DIGITAL eXcursion`), or start Performance Manager on a server node whose
DISPLAY
environment variable (in either the C shell or Bourne shell) is set to the PC. Either TCP/IP or DECnet` will work, but consider the following when displaying Performance Manager on a PC:
-
The PC and the Tru64 UNIX server node must know about each other. The PC's network name and address must be in the server node's /etc/hosts or DUS database file (TCP/IP), or NCP/NCL database (DECnet). The server node's network name must be in the PC's TCP/IP file or NCP/NCL database (DECnet).
-
When starting Performance Manager on a PC using an X server program (such as DIGITAL eXcursion), there can be error messages that the X server program cannot report, such as your user name not being authorized to run Performance Manager, LMF license check failure, and so forth. To check for such errors, start Performance Manager on the server node after setting DISPLAY to the PC.
-
Depending on how your PC's resources are configured, it is possible to overload eXcursion by displaying too many applications, especially large ones such as Performance Manager (as compared to small ones such as dxclock, dxterm, and dxcalendar). Overloading an X server program can cause odd, nonintuitive errors. If you see such errors, try closing a few applications and restarting Performance Manager.
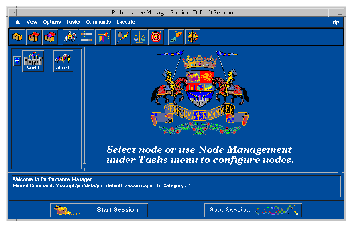
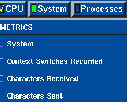
Main window overview
Clicking on a node, cluster, or group in Performance Manager's initial main window causes the work area to appear. The work area contains selection buttons for tasks and categories, and a scroll window for metric selection.
The Performance Manager main window
This is the opening window, and is the starting place for all your tasks.
Work area
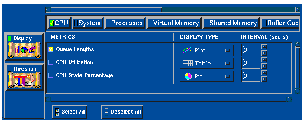
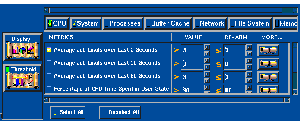
The Display and Threshold buttons each have a specific work area, showing related categories, metrics, and options.
Icons
The icons are sensitive. Click them to perform the operations in this section.
Main window icons
The nodes area, on the left side of the main window, displays icons for nodes you can monitor. By default, the local node is displayed and belongs to the group World.
To manage the nodes, clusters, and groups appearing in the nodes area, use the toolbar or go to the main window's Tasks menu and choose
Node Management
.
Nodes
A node is a computer system that is uniquely addressable on a network. A node can have more than one CPU. Single horses represent individual nodes in various states. Note that a node icon may take a few moments to reflect the state of the node after the node is newly added or comes up. A node icon changes to reflect one of the following three node states:
|

|
No knight: Node is down or invalid.
|
|

|
Knight standing: Node is up.
|
|

|
Knight on horse, with check mark: Node is up, metrics have been selected for monitoring.
|
A check mark indicates that metrics have been selected for monitoring. In addition, when a node is selected, the background color of the node icon will change.
|

|
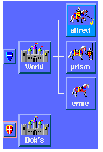
Clusters
A cluster is a collection of nodes that appear as a single-server system. Clusters offer application availability and scalability greater than is possible with a single system.
|
A cluster icon changes to reflect one of the following three states:
-
No knights: All nodes in the cluster are down or invalid.
-
Knights standing: At least one node in the cluster is up.
-
Knights on horses: Nodes are up.
A check mark indicates that metrics have been selected for have been selected for monitoring. When a cluster is selected the background color of the cluster icon changes.
|

|
Groups
A group is a collection of nodes and/or clusters that are frequently managed together. Castles represent these collections.
|
If the group icon shows a check mark, metrics have been selected for monitoring for every cluster and node in the group. When a group is selected the background color of the group icon changes.
|

Shields
A shield appears next to each castle (group)and set of three horses (cluster). A shield displaying a minus sign (-) shows that all nodes in the group or cluster are exposed. A shield showing the plus sign (+) shows that all nodes are hidden. Clicking on that shield exposes all the nodes and clusters inside.
|
|
|
|
|
Main window
buttons
Buttons are sensitive. Click them to perform the operations in this section.
|

Each category of metrics has its own button. This is the button for
the CPU metric category. Click on it to display the CPU metrics
available for threshold monitoring. Each metric category presents its
choices in a similar manner.
|
|

A metric category button looks like this when it is selected. The LED on the button shows bright green. |
|
|

|
A metric category button looks like this when it is no longer selected, but metrics within that category are selected.
|
|

|
A metric category button looks like this when both the category and the metrics within that category are selected.
|
|
|
|
|

When this button is on, the display work area is shown.
|
|

When this button is on, the threshold work area is shown.
|
|

This button (more...Advanced) is active only when the threshold work area is shown.
|
|

Click on this button to start the session currently specified. The displays and thresholds you have selected become active as soon as you click on this button. This button is active only when no session is running.
|
|
 Click on this button to stop the current session. All metric displays
close. This button is active only when a session is running.
Click on this button to stop the current session. All metric displays
close. This button is active only when a session is running.
|
Main window
toolbar and
menu bar
The toolbar and menu bar provide quick access to functions.
The main window has both a menu bar and a toolbar. Together they provide quick access to the functions of Performance Manager. The menu bar contains the following items, which are tear-off menus. If you click the underscored letter in each item, that menu will "tear off" and display separately.
Menus and menu commands
|
New Session
Clicking this link displays information on sessions.
Open Session
Clicking this link displays information on sessions.
Save Session
Clicking this link displays information on sessions.
Save Session As
Clicking this link displays information on sessions.
Exit
Clicking
Exit
quits the session.
|

|
|
Toolbar
Selects the toolbar for display.
Nodes
Selects the node area for display.
Work Area
Selects the work area for display.
Messages
Selects the message area for display.
|

|
|
Enable Tool Bar Label
Displays a label as the cursor passes over each toolbar icon.
|

|
|
Node Management
Provides access to the controls for adding, deleting, and moving nodes and clusters.
Category Management
Metric categories can be made visible or hidden. Visible categories are selectable for viewing.
Threshold Notifications
Presents a list of activity with a reporting window.
|

|
|
Configure
The Configure dialog box integrates your commands with Performance Manager.
Move
This dialog enables you to regroup commands in different categories.
Command Category Mgmt
This dialog enables you to add or delete command categories.
|

|
|
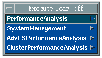
Performance Analysis
These commands detect performance problems and offer corrective advice in four areas: CPU, memory, network, and disk I/O.
System Management
These commands perform tasks on the node they are executing on.
Cluster Performance Analysis
These commands analysis cluster performance.
|
|
|
Overview
Clicking Overview opens the first window of the help volume. From this scroll box you can navigate to any topic.
Tasks
Clicking Tasks opens the Using Performance Manager section of the help volume. From this scroll box you can navigate to any topic.
Reference
Clicking Reference opens a section of the help volume with more information about the functions of Performance Manager than is available from On Item.
On Item
Clicking On Item changes the cursor to a question mark. Placing the question mark on an area of the GUI and clicking opens a help window with specific information.
Using Help
Clicking Using Help opens the CDE help volume, which explains how the help system works.
About Performance Manager
Clicking About Performance Manager opens the help window containing information about this software version, copyrights, and trademarks.
|

|
Toolbar icons
The toolbar icons are arranged by groups and represent these actions:
-
File Group
-
Clicking these links displays information on sessions.
|
|
|
|
|
|
New Session
|
Open Session
|
Save Session As
|
|
|
Node management provides access to the controls for adding, deleting, and moving nodes and clusters.
Use category management to make metric categories visible or hidden. Visible categories are selectable for monitoring.
Threshold notification presents a list of activity with a reporting window.
|
|
Node Management
|
Category Management
|
Threshold Notification
|
|
The
Configure
dialog box integrates your commands with Performance Manager.
The
Move
command enables you to regroup commands in different categories.
C
ommand Category Management
enables you to add or delete command categories.
|
|
|
|
|
|
Configure Command
|
Move Command
|
Command Category Management
|
|
Clicking
On Item
changes the cursor to a question mark. Placing the question mark on an area of the GUI and clicking opens a help window with specific information.
Clicking Overview opens the first window of the help volume. From this scroll box you can navigate to any topic.
|
|
|
|
|
On-Item Help
|
Overview Help
|
Modifying the main window
You can change the appearance of the main window. The background color can be changed by starting Performance Manager with a different background color; for example:
#
pmgr -fg black -bg salmon
You might want to do this to provide greater viewing contrast, but be careful not to choose a color that will obscure text, such as a black foreground that hides black text.
You can also modify the font and the foreground and background colors used in the interface by editing the X resource file
/usr/lib/X11/app-defaults/PM
.
 Starting Performance Manager