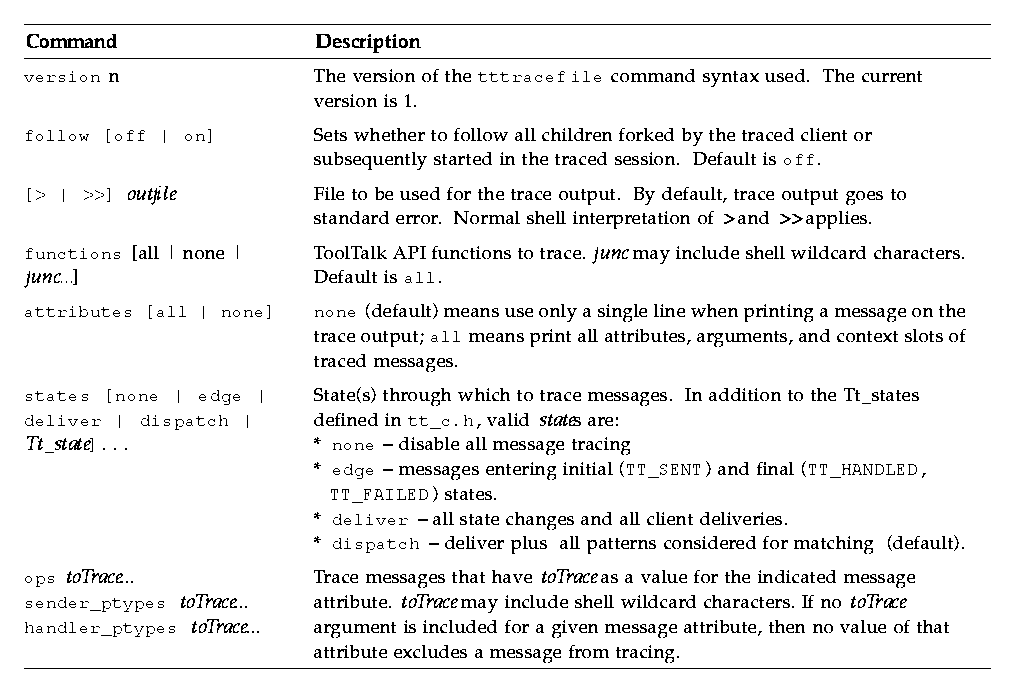


$TT_TRACE_SCRIPT .
int tt_trace_control(int option)
where option 0 to turn traciing off; 1 to turn tracing on; and -1 to toggle tracing on and off. When tracing is on, the extent of tracing is controlled by the TT_TRACE_SCRIPT variable or tracefile. This call returns the previous setting of the trace flag.
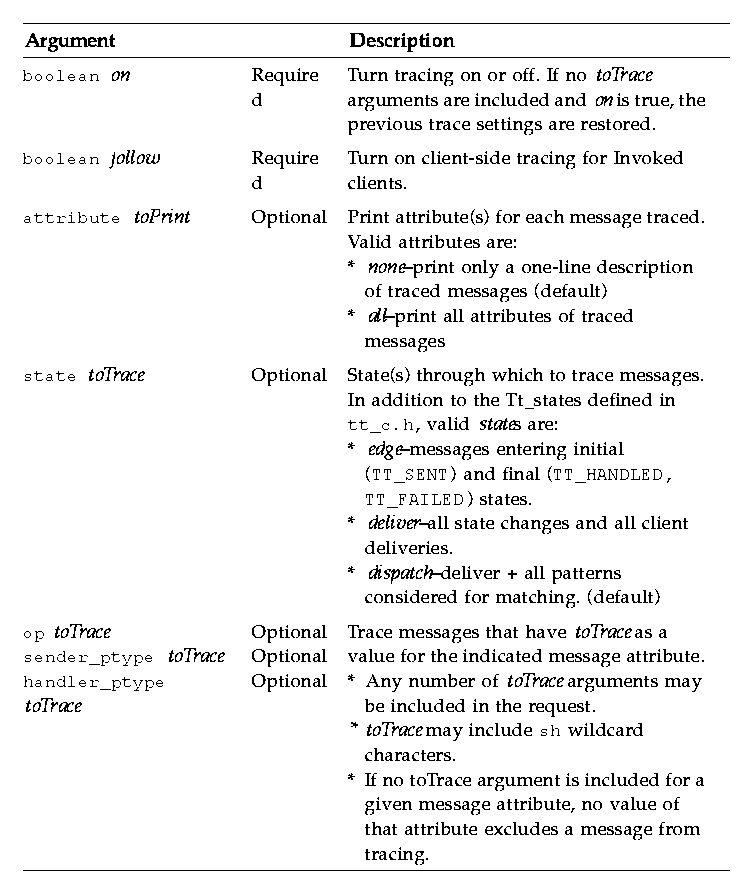
[file] Session_Trace(    in     boolean           on,
                         in     boolean           follow
                         [in    attribute         toPrint
                         |in    state             toTrace
                         |in    op                toTrace
                         |in    handler_ptype     toTrace
                         |in    sender_ptype      toTrace][...] );
The Session_Trace request turns message tracing in the scoped-to session on or off.
Table 4-1 Session_Trace Agurments 
The current session tracing behavior changes only if this request is not failed. On failure, the tt_message_status of the reply is set to one of the errors described in Table 4-2.
Table 4-2 Error Messages Returned by Session_Trace Request 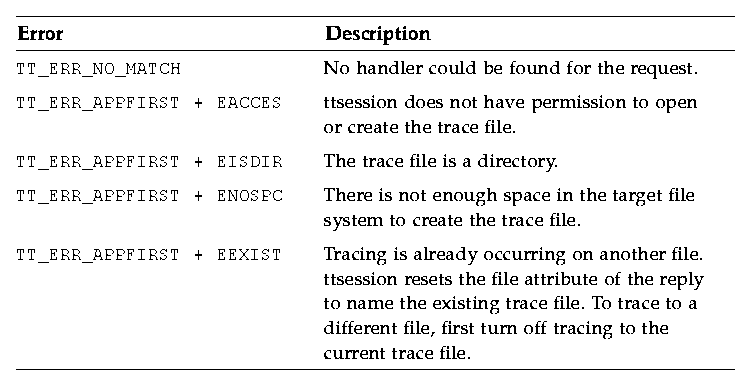
tttrace [-0FCa] [-o outfile ] [-S session | command]
tttrace [-e script | -f scriptfile ] [-S session | command]
Table 4-3 describes the tttrace options.
Table 4-3 tttrace Options 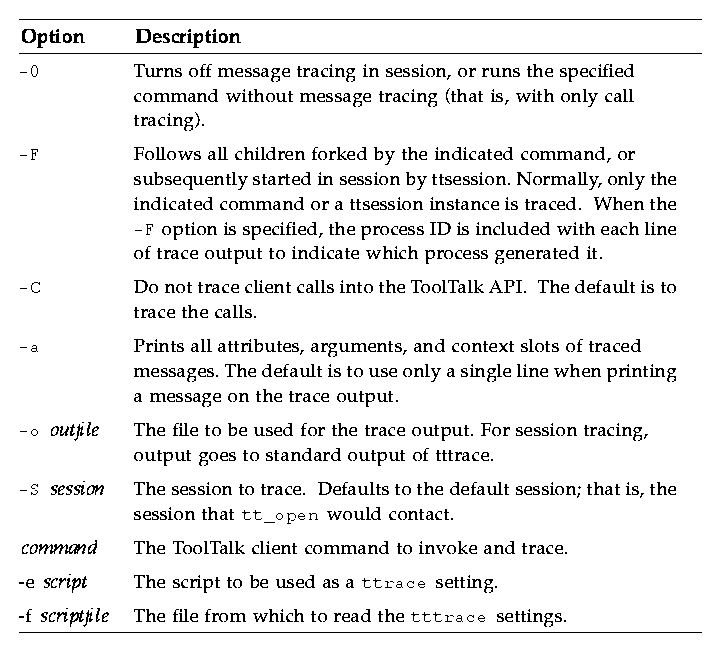
tttrace is implemented purely as a ToolTalk client, using the message interface to ttsession and the TT_TRACE_SCRIPT environment variable. If this variable is set, it tells libtt to turn on client-side tracing as specified in the trace script. If the first character of the value is '.' or '/', the value is taken to be the path name of file containing the trace script to use; otherwise, the value is taken to be an inline trace script.
[pid] function_name(params) = return_value (Tt_status)
Tt_state Tt_paradigm Tt_class (Tt_disposition in Tt_scope): status == Tt_status
old_state => new_state.
Tt_message => procid recipient_procid
Table 4-4 dexplains the messages you may receive during a dispatch trace.
Table 4-4 Reasons for Dispatch Trace 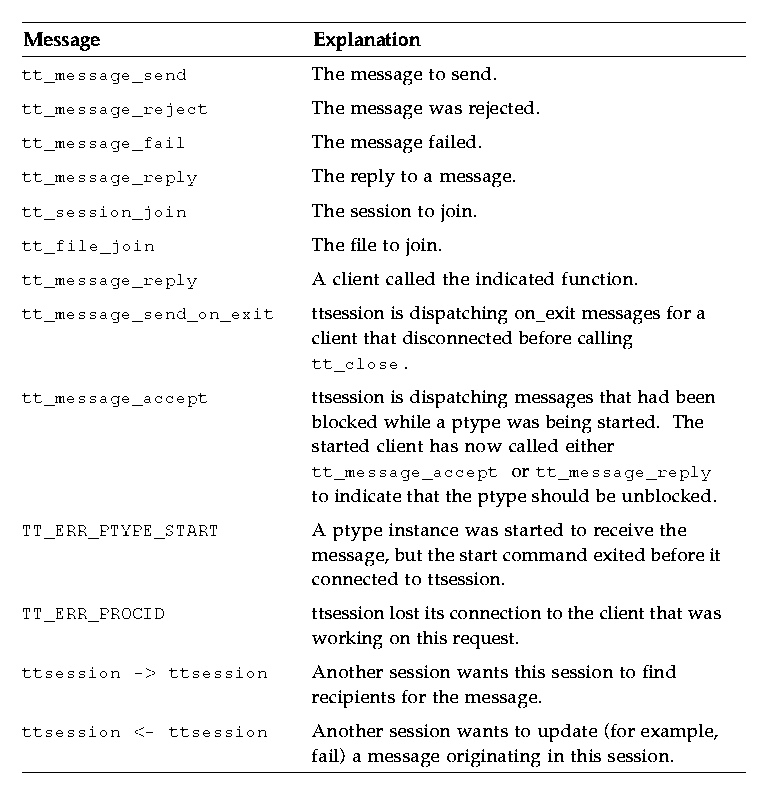
Tt_message & Tt_pattern {
Tt_message & ptype ptid {
Tt_message & otype otid {
formats:The pattern or signature is printed, followed by:
} == match_score; [/* mismatch_reason */]
% tttrace -a myclientprogram
Code Example 4-1 shows the results.Code Example 4-1 Registering a Pattern and Sending a Notice
tt_open() = 0x51708=="7.jOHHM X 129.144.153.55 0" (TT_OK)
tt_fd() = 11 (TT_OK)
tt_pattern_create() = 0x50318 (TT_OK)
tt_pattern_category_set(0x50318, TT_OBSERVE) = 0 (TT_OK)
tt_pattern_scope_add(0x50318, TT_SESSION) = 0 (TT_OK)
tt_pattern_op_add(0x50318, 0x2f308=="Hello World") = 0 (TT_OK)
tt_default_session() = 0x519e0=="X 129.144.153.55 0" (TT_OK)
tt_pattern_session_add(0x50318, 0x519e0=="X 129.144.153.55 0") = 0 (TT_OK)
tt_pattern_register(0x50318) = 0 (TT_OK)
tt_message_create() = 0x51af0 (TT_OK)
tt_message_class_set(0x51af0, TT_NOTICE) = 0 (TT_OK)
tt_message_address_set(0x51af0, TT_PROCEDURE) = 0 (TT_OK)
tt_message_scope_set(0x51af0, TT_SESSION) = 0 (TT_OK)
tt_message_op_set(0x51af0, 0x2f308=="Hello World") = 0 (TT_OK)
tt_message_send(0x51af0)    ...
    TT_CREATED => TT_SENT:
    TT_SENT TT_PROCEDURE TT_NOTICE (TT_DISCARD in TT_SESSION): 0 == TT_OK
    id:             0 7.jOHHM X 129.144.153.55 0
    op:             Hello World
    session:        X 129.144.153.55 0
    sender:         7.jOHHM X 129.144.153.55 0
= 0 (TT_OK)
tt_message_receive()    ...
    Tt_message => procid <7.jOHHM X 129.144.153.55 0>
    TT_SENT TT_PROCEDURE TT_NOTICE (TT_DISCARD in TT_SESSION): 0 == TT_OK
    id:             0 7.jOHHM X 129.144.153.55 0
    op:             Hello World
    session:        X 129.144.153.55 0
    sender:         7.jOHHM X 129.144.153.55 0
    pattern:        0:7.jOHHM X 129.144.153.55 0
= 0x51af0 (TT_OK)
To see ttsession's view of the message flow, type:
% tttrace -a
ttsession's view of mylientprogram's message flow is shown in Code Example 4-2. Code Example 4-2 ttsession's View of Trace
tt_message_reply:
    TT_SENT => TT_HANDLED:
    TT_HANDLED TT_PROCEDURE TT_REQUEST (TT_DISCARD in TT_SESSION): 0 == TT_OK
    id:        0 2.jOHHM X 129.144.153.55 0
    op:        Session_Trace
    args:      TT_IN string: "> /tmp/traceAAAa002oL; version 1; states"[...]
    session:   X 129.144.153.55 0
    sender:    2.jOHHM X 129.144.153.55 0
    pattern:   0:X 129.144.153.55 0
    handler:   0.jOHHM X 129.144.153.55 0
    Tt_message => procid <2.jOHHM X 129.144.153.55 0>
tt_message_send:
    TT_CREATED TT_PROCEDURE TT_NOTICE (TT_DISCARD in TT_SESSION): 0 == TT_OK
    id:        0 7.jOHHM X 129.144.153.55 0
    op:        Hello World
    session:   X 129.144.153.55 0
    sender:    7.jOHHM X 129.144.153.55 0
    TT_CREATED => TT_SENT:
    TT_SENT TT_PROCEDURE TT_NOTICE (TT_DISCARD in TT_SESSION): 0 == TT_OK
    id:        0 7.jOHHM X 129.144.153.55 0
    op:        Hello World
    session:   X 129.144.153.55 0
    sender:    7.jOHHM X 129.144.153.55 0
    Tt_message & Tt_pattern {
    id:        0:7.jOHHM X 129.144.153.55 0
    category:  TT_OBSERVE
    scopes:    TT_SESSION
    sessions:  X 129.144.153.55 0
    ops:       Hello World
    } == 3;
    Tt_message => procid <7.jOHHM X 129.144.153.55 0>
% tttrace -S "01 15303 1342177284 1 0 13691 129.144.153.55 2"
where "01 15303 1342177284 1 0 13691 129.144.153.55 2" is the specific, non-default session to be traced.
Table 4-5 tttrace Script Commands 